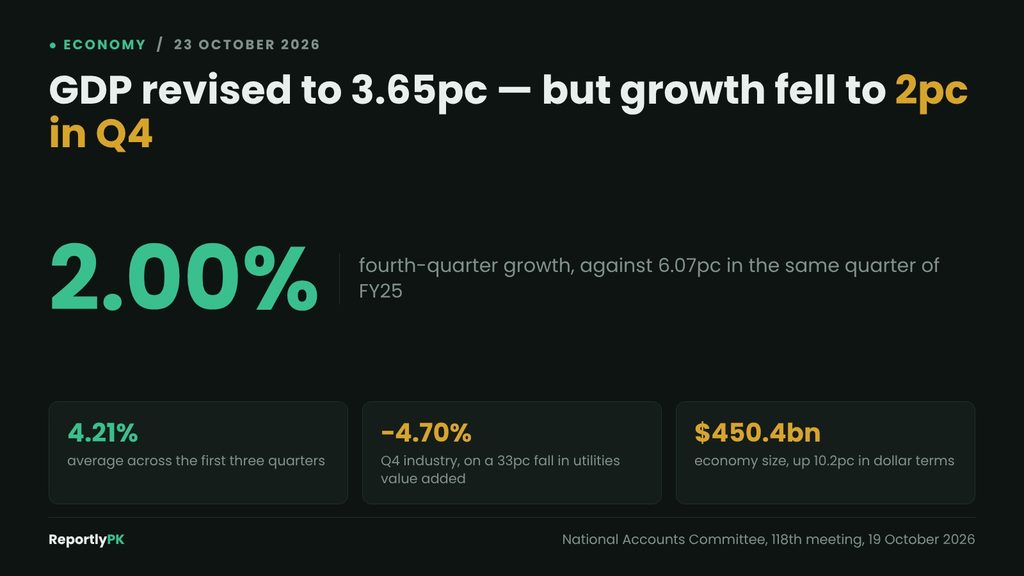
The National Accounts Committee has revised Pakistan GDP growth for FY26 down to 3.65 percent from 3.70 percent, and put the size of the economy at Rs126.4 trillion, or about $450.4 billion. Per capita income is Rs531,897, roughly $1,896.
The headline revision is trivial. What sits underneath it is not: the economy grew 4.42 percent in the third quarter and 2.00 percent in the fourth.
The quarters, and where the year was lost
- Q1: 3.89 percent, revised from 3.92
- Q2: 4.31 percent, revised up from 4.05
- Q3: 4.42 percent, revised up from 3.99
- Q4: 2.00 percent, against 6.07 percent in Q4 FY25
- Full year: 3.65 percent — exactly the average of the four quarters
The first three quarters averaged 4.21 percent. Had the fourth matched them, FY26 would have printed above 4 percent and the government’s target would have been met. The year was decided in its final three months.
This confirms an inference available earlier. When the IMF reported 4 percent growth across the first three quarters against a 3.6 percent full-year estimate, the arithmetic implied a fourth quarter of roughly 2.4 percent. The actual figure is 2.00 percent — slightly worse than the gap suggested.
A 33 percent fall that needs explaining
Industry contracted 4.70 percent in the fourth quarter. The stated driver is a 33.19 percent fall in electricity, gas and water supply.
Pakistan did not generate a third less electricity. This is a value-added measure, and in Pakistan’s national accounts the value added by the electricity sub-sector is computed net of subsidies, which makes it swing violently with fiscal decisions that have nothing to do with how much power was produced. A change in how subsidies were recorded or paid can move this line by tens of percent while physical output barely shifts.
That matters for how the quarter should be read. A 2 percent quarter driven by a statistical treatment of energy subsidies is a different economic event from a 2 percent quarter driven by factories reducing output, and the release does not separate them. Agriculture grew 3.71 percent and services 3.62 percent in the same quarter, which is not the pattern of a broad slowdown.
Related: Circular debt hits Rs5.3 trillion — and two-thirds of it is gas
Where the revisions went
The full-year sector estimates moved in both directions. Agriculture was revised up to 3.50 percent from 2.89. Industry came down to 3.34 percent from 3.51, with large-scale manufacturing cut to 5.01 percent from 6.11. Services fell to 3.81 percent from 4.09, with wholesale and retail trade reduced to 2.37 percent from 3.71.
The wholesale and retail revision is the one worth pausing on. Cutting that estimate by more than a third suggests consumption was weaker than first measured, and it is the sector most directly connected to household spending power in a year when inflation stayed in double digits.
The Committee also revised FY25 growth down to 3.11 percent from 3.18, and approved incorporating revised import data into the national accounts for FY2021 through FY2025.
The $450 billion is mostly not growth
The economy’s dollar size rose from about $408.7 billion to $450.4 billion, an increase of 10.2 percent. Real growth was 3.65 percent.
The difference is price. Nominal GDP in rupees rose 10.0 percent, which against 3.65 percent real growth implies a deflator of about 6.1 percent. The dollar figure then held up because the exchange rate barely moved — the implied average rate was close to Rs281 in both years.
So roughly two-thirds of the headline increase in the dollar size of Pakistan’s economy is inflation that the rupee’s stability failed to erase, rather than additional output. A country whose currency depreciates in a given year can grow in real terms and shrink in dollars; Pakistan did the reverse.
Revisions of this size are the normal state
Several of the changes approved at this meeting are larger than the headline revision. Q3 moved up by 0.43 points, agriculture by 0.61, and wholesale and retail trade down by 1.34 — against a full-year figure that shifted by 0.05.
That is worth stating plainly because growth figures are reported as though they were measurements. They are estimates assembled from surveys, tax records and production data that arrive on different schedules, and they are revised as better information comes in. The Committee also approved incorporating revised import data stretching back to FY2021, which will move the historical series.
The practical implication is to treat differences of a few tenths of a point between forecasts and outturns as noise. The IMF’s 3.5 percent and the government’s 4 percent for FY27 are close enough that the gap may well be resolved by a future revision rather than by the economy.
What this does to the FY27 forecasts
The IMF has FY27 growth at 3.5 percent; the government is targeting 4 percent and the finance minister has said he is confident of exceeding it.
A fourth quarter at 2.00 percent is a weak handover into the new fiscal year, and the base effect runs the other way for FY27: a low Q4 FY26 makes the corresponding FY27 quarter easier to beat. Whether that flatters the coming year depends on whether the energy-sector distortion that produced the number repeats.
Per capita income of $1,896 is the figure that travels furthest and means least on its own. It is an average across a population whose income distribution the national accounts do not describe, and it rose for the same reason the dollar GDP did.