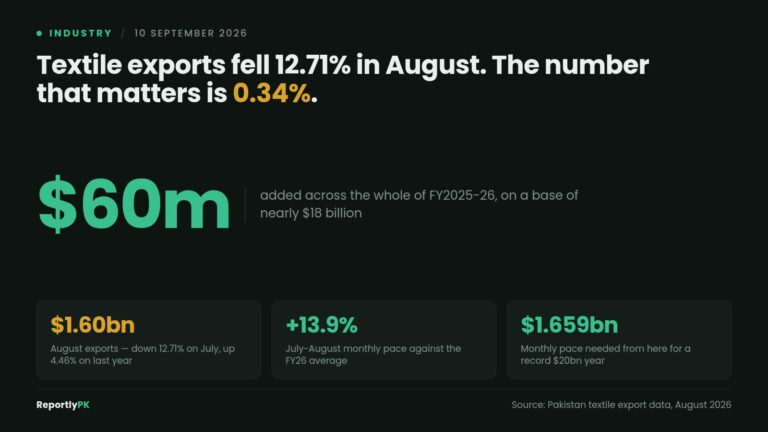
Pakistan textile exports fell 12.71 percent in August, dropping to $1.60 billion from $1.83 billion in July. That is the number being reported. It is not the number that matters.
The one that matters is 0.34 percent — the growth Pakistan’s largest export sector managed across the whole of FY2025-26.
The month, put back in context
August’s fall came off an unusually strong July. This site flagged at the time that July’s headline 43 percent month-on-month jump was an artefact of the base it was measured against, and that the defensible underlying figure was closer to 8 percent. A month that was overstated on the way up produces a fall on the way down.
Measured year-on-year, August was actually up 4.46 percent on the $1.53 billion recorded in August 2025. Monthly textile figures swing on shipment timing, vessel schedules, holidays and buyer order cycles. A single month is not a trend in this series and never has been.
$60 million on $18 billion
FY2025-26 closed at $17.97 billion, against $17.91 billion the year before. In absolute terms the sector added about $60 million over twelve months on a base of nearly eighteen billion dollars.
That is not growth in any economically meaningful sense. Against inflation in input costs, wages and energy over the same period, a 0.34 percent nominal increase is a real-terms contraction. It happened in a year that also delivered a Moody’s upgrade, a record Eurobond and a fiscal deficit at a two-decade low. Whatever improved in Pakistan’s macroeconomic position in FY26, it did not reach the export line.
For scale: Pakistan’s remittance inflows are currently running at an annualised rate above $43 billion. The entire textile export sector, the largest industrial employer in the country, brings in less than half that.
The start to this year is genuinely better
Set against that backdrop, the July-August performance is the encouraging part of the release rather than the worrying one.
The two months together produced $3.41 billion, up 6.76 percent on the same period a year earlier. That works out to a monthly average of about $1.705 billion. The FY2025-26 monthly average was $1.498 billion.
FY2026-27 has therefore opened running roughly 13.9 percent above last year’s monthly pace. If that held for twelve months it would put the sector above $20 billion for the first time. Two months is not twelve, and the second half of a Pakistani fiscal year carries its own energy and cotton-supply risks. But the direction at the start of this year is better than anything FY26 produced.
What the rest of the year has to deliver
The two-month figure lets you work out what FY2026-27 actually requires from here, which is more useful than either the August drop or the July spike.
To simply match FY26’s $17.97 billion, the remaining ten months need to produce $14.56 billion — a monthly average of about $1.456 billion. That is below last year’s own monthly average of $1.498 billion. Barring an energy shock or a cotton failure, FY27 beating FY26 is close to arithmetically locked in already.
To reach $20 billion, a level the sector has never hit, the remaining ten months need $16.59 billion, or about $1.659 billion a month. The July-August pace is $1.705 billion. The required run rate for a record year is slightly lower than the rate the sector is currently running at.
That is a possibility rather than a forecast. The second half of a Pakistani fiscal year carries gas curtailment for industry, the post-harvest cotton position and whatever the exchange rate does. But it reframes what August was: not evidence the year is going wrong, rather one soft month inside a start comfortably ahead of a year that went nowhere.
No reason was given, and that is the norm
The August release offers no explanation for the monthly decline, and no breakdown between value-added categories — knitwear, bedwear, readymade garments — and basic ones such as cotton yarn and cloth.
That split is the whole story of Pakistani textile policy. A dollar of knitwear carries far more domestic value addition, employment and margin than a dollar of yarn. A headline total that moves without that composition attached cannot tell you whether the sector is climbing the value chain or sliding back down it. Both a good month of garment shipments and a bad month of yarn exports show up as one number.
What would actually move the trajectory
The sector’s own representatives have spent the past year describing a competitiveness problem rather than a demand problem — regional buyers are placing orders, and the argument is about where those orders land.
Three variables decide that, and none of them is textile policy as such. Energy cost per unit of output, against competitors on cheaper industrial tariffs. Working capital, specifically how long refund claims sit unpaid with the tax authority while a mill funds the same order twice. And cotton supply, where a short domestic crop forces imported lint and imports the cost of foreign currency into the input bill.
A 0.34 percent year is what happens when all three sit where they currently sit. A 13.9 percent monthly pace at the start of FY27 suggests at least one of them has eased. Which one is the question the August release does not answer, and the September data will not answer either unless the composition breakdown comes with it.
Related: Textile Exports Rose 43% in a Month. The Real Number Is 8%.